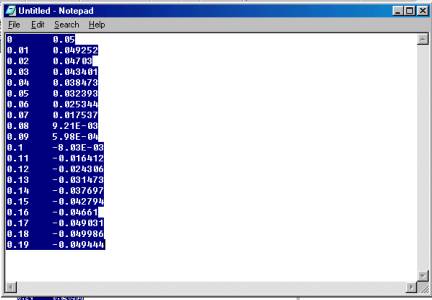
- Open a .txt file provided by the physics class in
Notepad. Highlight only the two columns of numbers and do Edit-Copy:
- Start Excel and open the spreadsheet oscillation.xls.
- Highlight columns A2 and B2 and hit control-V or the Paste
button
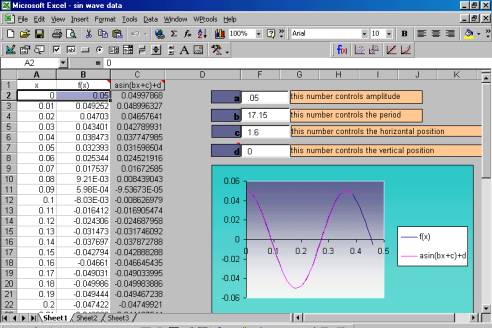
This will place the Stella data into the Excel spreadsheet. If done
correctly, the graph of the data should appear to the right.
- From the graph, calculate the coefficients and enter them in
the appropriate boxes above the graph. If you’re doing a good job, the pink graph should begin to look like the
blue graph.
Hint: by placing the mouse pointer near the blanks,
a description of how to calculate the coefficient is provided (just in case you
forgot)
Once your pink and blue graphs match, you have determined
the mathematical model for the Stella data. You may need to adjust some of the values you calculated
to make the two graphs match.
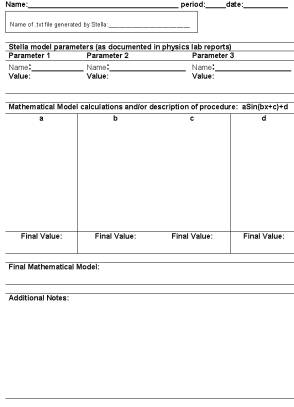
Complete a report sheet for each data set you work on. Show
all your calculations and provide verbal descriptions and remarks where
appropriate: