Chimes
Chimes - Length vs. Frequency
Updated 08/13/04
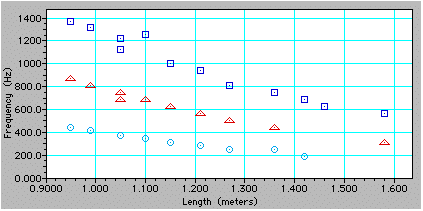
Physics students took a field trip to the band room. There they measured
the length of the chimes and recorded the sound of each chime using the
TI-82 graphing calculator and a CBL. The signals were processed through
MATLAB and the frequencies determined. Graphs of the results are given
below.
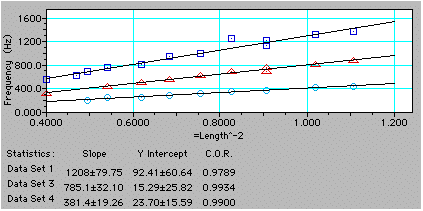
There seems to be a strong inverse square correlation. A similar result
was obtained earlier in the week when the students graphed the length of a
tuning fork tine vs. its frequency.
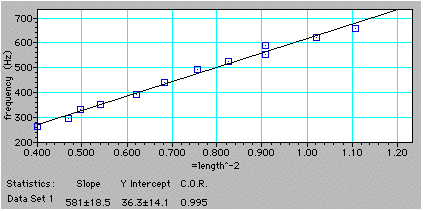
A graph of the reported frequency vs. length is included. The inverse
square result still holds, but the slope is different. Given results from
the musical instruments, we know that the 99 data points is not really
sufficient to get the true frequencies. We plan to repeat the experiment
with the TI-83 in the future.
Data collected using a CBL and TI-82 calculator

Sample size - 99 points
| Note | Length(m) | Frequency 1 (Hz) | Frequency
2 (Hz) | Frequency 3 (Hz) | Frequency 4 (Hz) |
|---|
| C | 1.58 | - | 313.1 | 560.6 | - |
| D | 1.46 | - | - | 626.3 | - |
| E | 1.42 | 191.9 | - | 686.9 | 1000 |
| F | 1.36 | 252.5 | 439.4 | 752.5 | 1060.6 |
| G | 1.27 | 252.5 | 500 | 813.1 | 1186.9 |
| A | 1.21 | 287.9 | 560.6 | 939.4 | 1318.2 |
| B | 1.15 | 313.1 | 626.3 | 1000 | - |
| C | 1.10 | 343.4 | 686.9 | 1252.5 | - |
| C# | 1.05 | 373.7 | 686.9 | 1126.3 | 1686.9 |
| D | 1.05 | 368.7 | 752.5 | 1217.2 | - |
| D# | 0.99 | 414.1 | 813.1 | 1313.1 | - |
| E | 0.95 | 439.4 | 873.7 | 1373.7 | - |
Graph of chime length vs measured frequencies

Graph of chime length^-2 vs measured frequencies

Graph of chime length^-2 vs given fundamental frequency

Graphs created using Vernier's Graphical Analysis


