RiverWeb Tour
Instructions
Examining the subrange
Scroll the RiverWeb frame (and this frame)
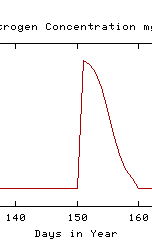
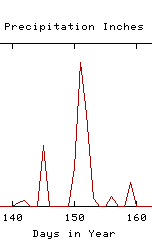
to note that a peak in phosphorus concentration does coincide with the
precipitation peak at day 150.

 Also notice the
link View pre-implementation Data below
each graph which allows access to the current range of data (for that particular
graph).
Now return to the Station 0 default values by clicking on the zero on the map in the lower left corner of the RiverWeb frame. Then click on "Using RiverWeb Scatterplots" (menu frame).


