
|
 |
||
|
Login Vision Development Teachers Students Tour Site Map Team Contact Us |
Simulator FunctionalityLearner Interface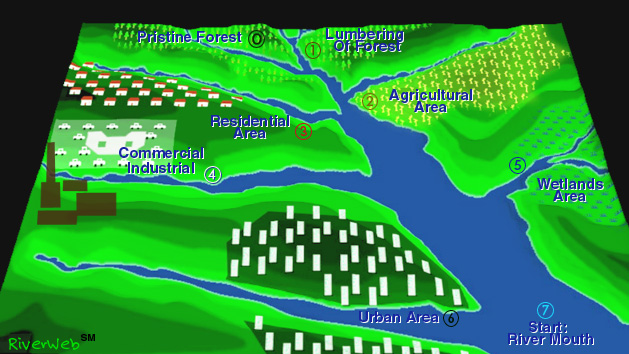
Water quality monitoring stations located throughout the watershed are depicted in the map. The user may click on the map to investigate any sub-watershed. The RiverWeb graph window also appears. By default it displays the variation of nitrogen over time in the top window, and precipitation over time in the bottom window. As shown below, other indicators may be selected, or the user might compare nitrogen concentration between two stations. 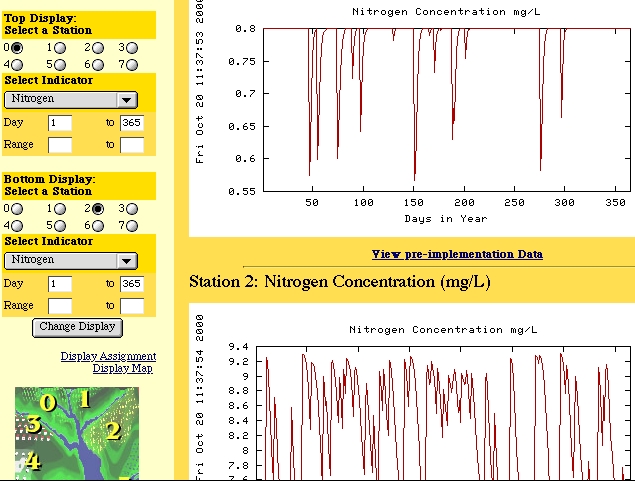
In addition, reducing the day range for each graph provides the ability to zoom in on a particular time period. A scatter plot is available to further delineate the relationship of the pair of indicators or stations. A digital notebook link is keyed to questions related to the indicators currently selected. The Tour option, which may be selected at login, uses frames to combine the WQS with instructions leading the user through most of the simulator capabilities. Clicking on a hyperlink in the graphical display evokes a web-based notebook which is linked to a flexible database on the server side. The notebook provides a space for students to record their observations, pose hypotheses, and answer questions designed to promote problem-solving as they explore connections between watershed variables. Teachers can use the notebook to structure their students' explorations by customizing the questions to fit the needs of their students and curriculum, and to assess student learning. Scientific and Computational ModelEquations from a revised STELLA model were used as the basis of source code written in Fortran and compiled on the MVHS web server. The RiverWeb frontend, rewritten in PHP in the summer of 2005, takes the data file generated by the Fortran executable and creates graphs and a user interface to control the data plot. Indicators and stations are selected by the user. The server-side executables provide not only time series graphs showing change in a selected indicator over time, but also scatter plots depicting quantitative relationships between two indicators, for example sediment versus runoff. The scatter plots require that the selected time range in days be the same for both indicators. However, scatter plots of lag relationships may be created for one time series when offset from the other. The server-side capabilities described above support calls from multiple clients simultaneously, since all files are named by the process ID of the script invoked when the user submits a graphical display request to the server. |
||
|
MVHS & The University of Illinois All Rights Reserved |
[ Tour | Site Map | Team | Contact Us ] |