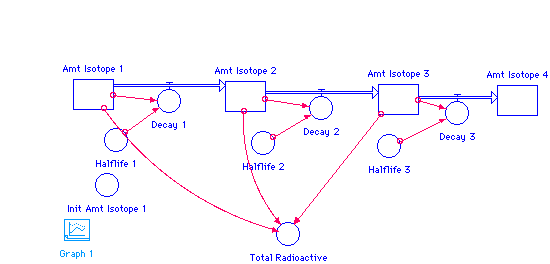
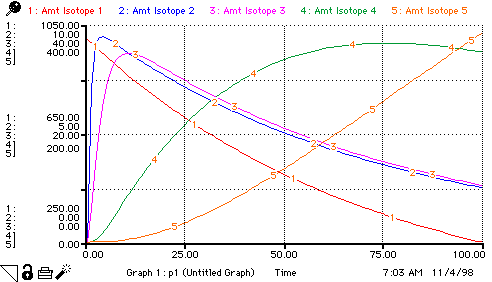
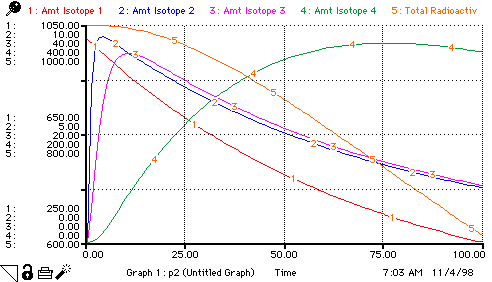
The stocks are animated in the classroom version, and this adds to student understanding. After viewing it the first time, students wanted to adjust the graph so that there was only one scale on the left. They quickly discovered that this "hides" much of what is going on because of relative size. It is presented here with the multiple scale format.
|
|
Vensim Version
|
STELLA Version
|

Amt_Isotope_1(t) = Amt_Isotope_1(t - dt) + (- Decay_1) * dt
INIT Amt_Isotope_1 = Init_Amt_Isotope_1

Decay_1 = LOGN(2)*Amt_Isotope_1/Halflife_1
Amt_Isotope_2(t) = Amt_Isotope_2(t - dt) + (Decay_1 - Decay_2) * dt
INIT Amt_Isotope_2 = 0

Decay_2 = LOGN(2)*Amt_Isotope_2/Halflife_2
Amt_Isotope_3(t) = Amt_Isotope_3(t - dt) + (Decay_2 - Decay_3) * dt
INIT Amt_Isotope_3 = 0

Decay_3 = LOGN(2)*Amt_Isotope_3/Halflife_3
Amt_Isotope_4(t) = Amt_Isotope_4(t - dt) + (Decay_3) * dt
INIT Amt_Isotope_4 = 0

Halflife_1 = 50
Halflife_2 = 0.5
Halflife_3 = 2
Init_Amt_Isotope_1 = 1000
Total_Radioactive = Amt_Isotope_1+Amt_Isotope_2+Amt_Isotope_3
Time Specs
Range: 0 - 100, dT = 1, Integration Method = Runge-Kutta 4

