heat_total(t) = heat_total(t - dt) + (change_in_heat) * dt
INIT heat_total = 0

change_in_heat = DT
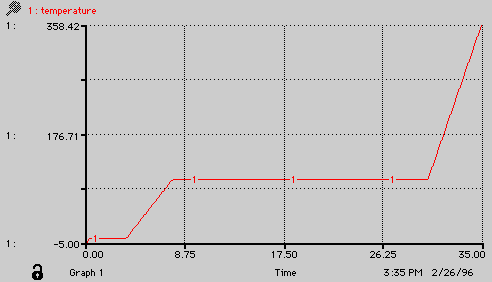
temperature(t) = temperature(t - dt) + (temp_change) * dt
INIT temperature = Initial_temp


temp_change = IF(temperature < fpt) THEN(change_in_heat/(mass*solid))
	ELSE IF(temperature >=fpt)AND (heat_total<(fusion+Plateau_1))
	THEN(0) ELSE IF (temperature > fpt)
	AND (temperature < bp) THEN (change_in_heat/(mass*liquid))
	ELSE IF (temperature  >=bp) AND
	(heat_total < (fusion+Plateau_1+Plateau_2+vaporization))
	THEN (0) ELSE(change_in_heat/(mass*vapor))

bp = 100
fpt = 0
fusion = .334
Initial_temp = -5
liquid = .00418
mass = 1

Plateau_1 = IF(Initial_temp < fpt) THEN
	(mass*solid*(fp-Initial_temp))ELSE(0)
Plateau_2 = mass*liquid*(bp-fpt)
solid = .00209
vapor = .00184
vaporization = 2.26
Time Specs
Range: 0 - 35; dT = 0.1; Integration Method = Runge-Kutta 2