Teacher Materials
Student Activity
Student
Assessment
Learning
Goals/Standards
Based on a model from Rick Heupel, Tucson, AZ
STELLA Versions
- isee Player software
- Right-click to download the models
- Vensim PLE Software
- Right-click to download the model
Web-based Simulation
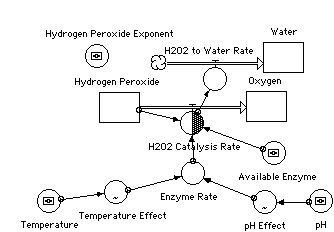
INIT Hydrogen_Peroxide = 1*10^(Hydrogen_Peroxide_Exponent)
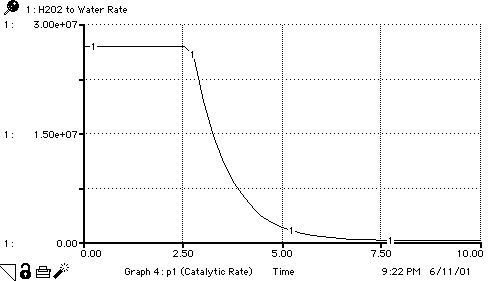
H2O2_Catalysis_Rate(o) = min(Enzyme_Rate*Available_Enzyme,Hydrogen_Peroxide)
Oxygen(t) = Oxygen(t - dt) + (H2O2_Catalysis_Rate) * dt
INIT Oxygen = 0
H2O2_Catalysis_Rate(i) = H2O2_Catalysis_Rate(o) * CONVERSION MULTIPLIER
CONVERSION MULTIPLIER = 0.5
Water(t) = Water(t - dt) + (H2O2_to_Water_Rate) * dt
INIT Water = 0
H2O2_to_Water_Rate = H2O2_Catalysis_Rate
Available_Enzyme = 5
Enzyme_Rate = 6e6 * pH_Effect*Temperature_Effect
Hydrogen_Peroxide_Exponent = 8
pH = 7.0
Temperature = 20
pH_Effect = GRAPH(pH) (0.00, 0.00), (1.08, 0.00), (2.15, 0.00), (3.23, 0.00), (4.31, 0.2), (5.38, 0.8), (6.46, 1.00), (7.54, 1.00), (8.62, 0.8), (9.69, 0.2), (10.8, 0.00), (11.8, 0.00), (12.9, 0.00), (14.0, 0.00)
Temperature_Effect = GRAPH(Temperature) (0.00, 0.01), (7.14, 0.1), (14.3, 0.5), (21.4, 1.00), (28.6, 1.00), (35.7, 1.00), (42.9, 0.9), (50.0, 0.5), (57.1, 0.005), (64.3, 0.00), (71.4, 0.00), (78.6, 0.00), (85.7, 0.00), (92.9, 0.00), (100.0, 0.00)