The three epidemic models below can each be used to experiment with various factors to see the impact on the populations. Vensim or STELLA software is needed to run the models. Right-click on the model link to download the model.
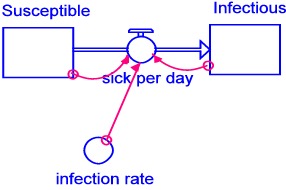
Simple Epidemic Model - STELLA
Assumes the infected people never leave the system
|
Infectious(t) = Infectious(t - dt) + (sick_per_day) * dt
INIT Infectious = 1 Susceptible(t) = Susceptible(t - dt) + (- sick_per_day) * dt INIT Susceptible = 999 sick_per_day = Infectious*Susceptible*infection_rate infection_rate = .0015 |
|
|
||
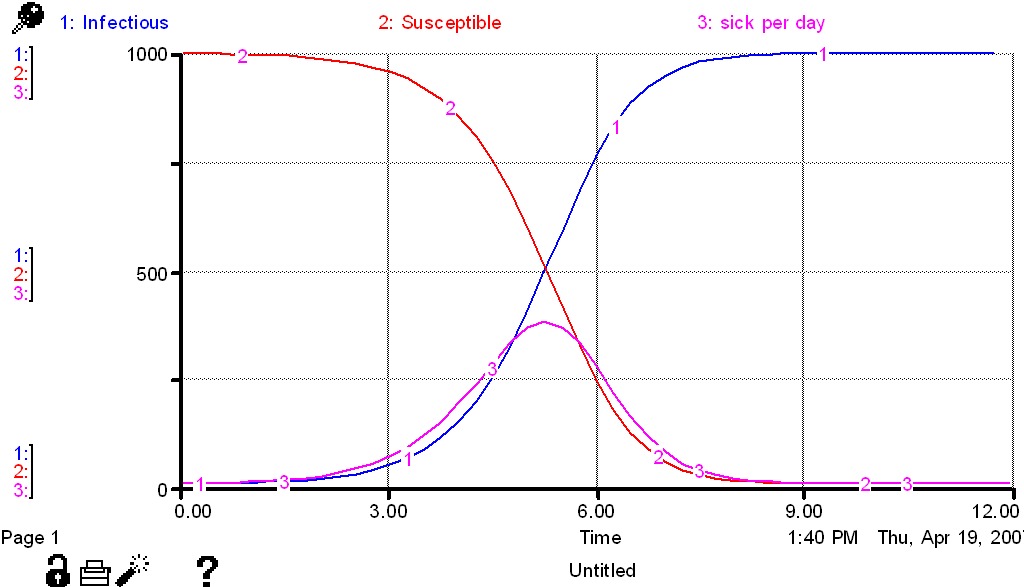
1. The simple epidemic model may be used to explore the impact of the infection rate variable on the healthy and infected populations. Change the infection rate and record the change in the output of the model. How does the shape of the s-shaped growth curve change? At what time does the model stabilize?
Infection Rate Stabilization Time Shape of Curve2. Exponential growth usually occurs when the rate of change is proportional to the amount present. Steady-state occurs when the system reaches equilibrium. Why does this model yield an s-shaped curve?
3. This model could be used to represent the spread of a highly contagious disease in a population living in close quarters, such as a college dorm, a military barracks, or a tribal village. This model shows how quickly a new virus could spread in a population with no immunity. What are some examples that you could use in your class?
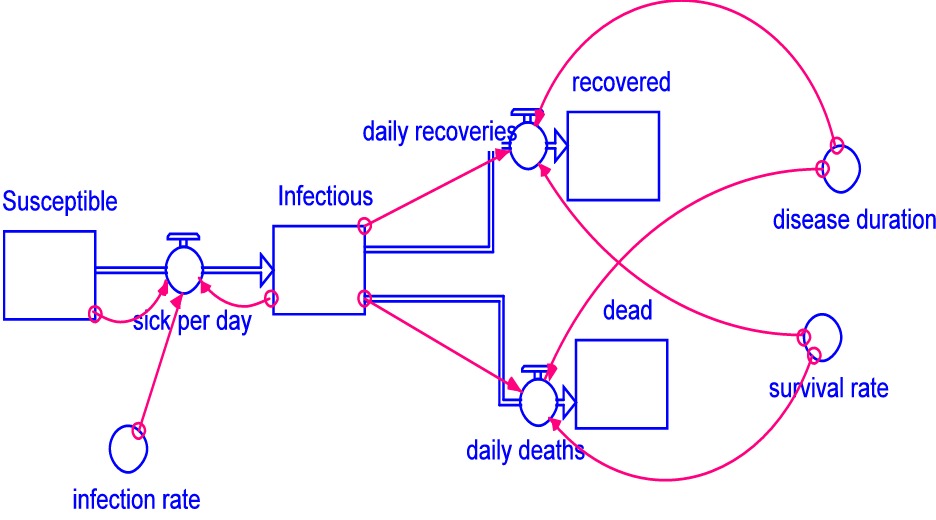
Second Epidemic Model - STELLA
Assumes that infected people recover or die and therefore cannot continue infecting others
|
||
|
dead(t) = dead(t - dt) + (daily_deaths) * dt INIT dead = 0 Infectious(t) = Infectious(t - dt) + (sick_per_day - daily_recoveries - daily_deaths) * dt INIT Infectious = 1 recovered(t) = recovered(t - dt) + (daily_recoveries) * dt INIT recovered = 0 Susceptible(t) = Susceptible(t - dt) + (- sick_per_day) * dt INIT Susceptible = 999 daily_deaths = Infectious*(1-survival_rate)/disease_duration daily_recoveries = Infectious*survival_rate/disease_duration sick_per_day = Infectious*Susceptible*infection_rate disease_duration = 5 infection_rate = .0015 survival_rate = .70 |
||
|
||
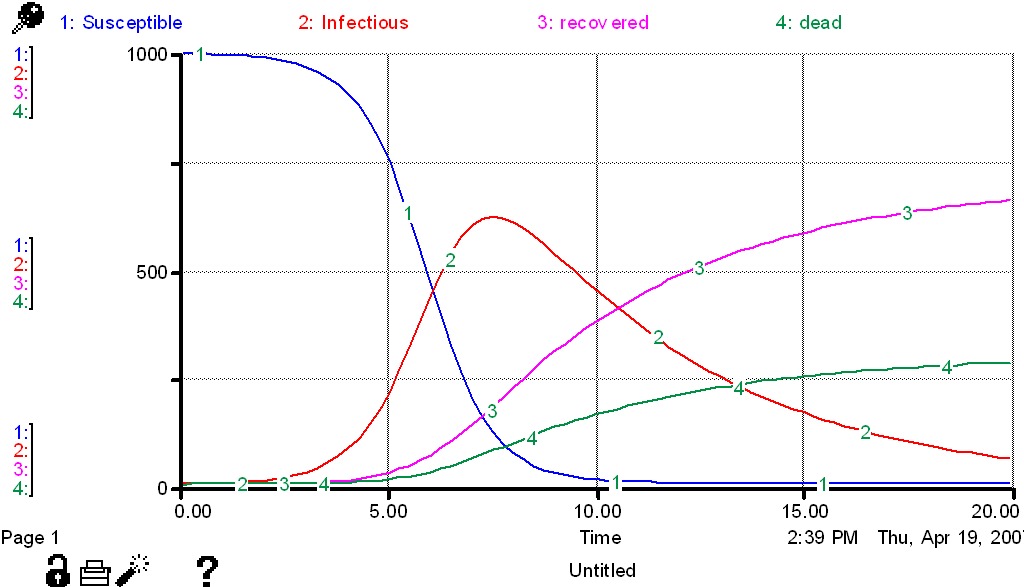
4. In a college dorm, the common cold or the flu would spread very quickly, but infected students would recover. This model could be used to experiment with disease duration and survival rate to see the effect on the population. By altering contact rate, duration or survival rate, try to achieve the following goals:
a) There are no susceptible people left
b) All people become immune
c) The entire population dies
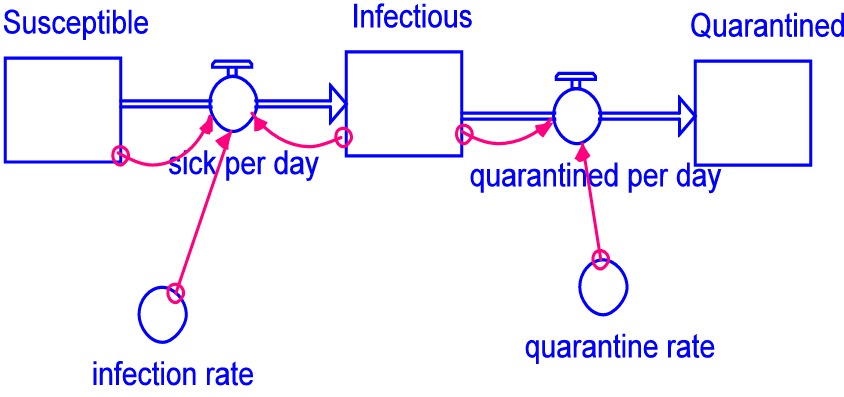
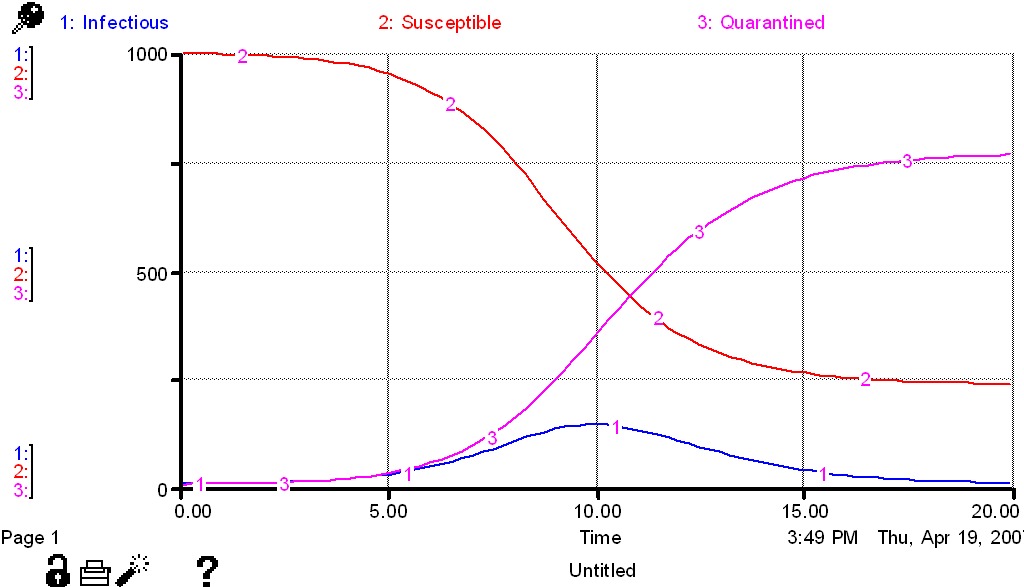
Third Epidemic Model - STELLA
Assumes that infected people become visibly sick and are removed from the general population so they can affect only a few caregivers
|
||
|
Infectious(t) = Infectious(t - dt) + (sick_per_day - quarantined_per_day) * dt INIT Infectious = 1 Quarantined(t) = Quarantined(t - dt) + (quarantined_per_day) * dt INIT Quarantined = 0 Susceptible(t) = Susceptible(t - dt) + (- sick_per_day) * dt INIT Susceptible = 999 quarantined_per_day = Infectious*quarantine_rate sick_per_day = Infectious*Susceptible*infection_rate infection_rate = .0015 quarantine_rate = .8 |
||
|
||
5. According to the Threshold Theorem of Epidemiology, the ratio of the quarantine rate to the infection rate determines whether an illness turns into an epidemic. Use the model above to find the ratio that will result in approximately 50% of the population getting the disease.
6. Design an epidemic model which incorporates any of the features below into the Third Epidemic Model.
a) Introduce births and natural deaths into the population
b) Introduce a vaccination program to prevent susceptible people from getting sick. How many must be vaccinated to reach steady state in the model?
7. Set up a STELLA model of the transmission of aids in the United States by identifying various segments of the population and their probability of engaging in behavior that puts them in danger of becoming infected.
Stocks
- Children
- Healthy, HIV Positive, Aids, Dead
- Women
- Low Risk, Drug Abusing, Heterosexual, HIV Positive, Aids, Dead
- Men
- Low Risk, Drug Abusing, Heterosexual, Bisexual, Gay, HIV Positive Heterosexuals, HIV Positive Bisexuals, HIV Positive Gays, Aids, Dead