|
Shadow Tracks Project |
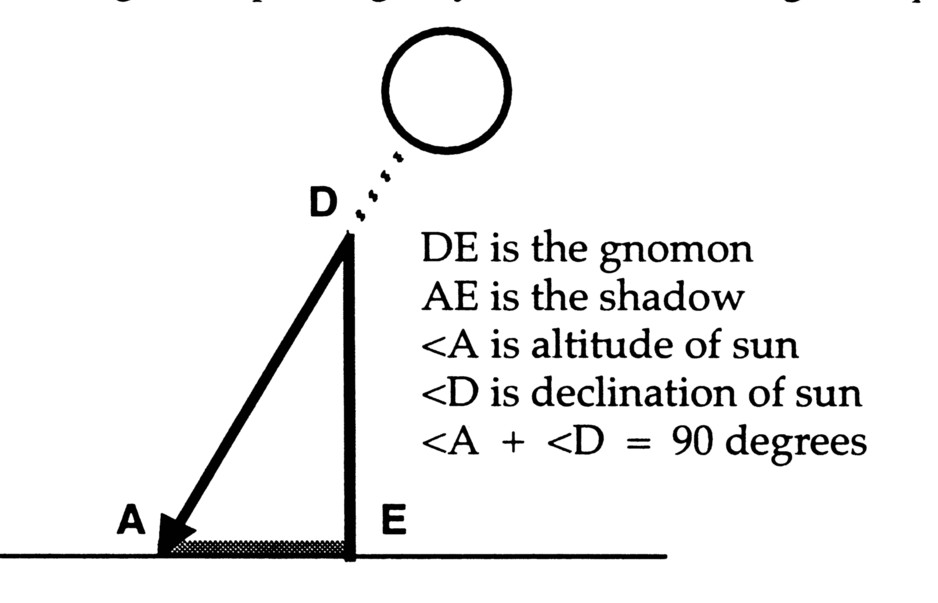
| Over two thousand years ago, Eratosthenes observed that at noon on the first day of summer, the sun cast no shadow in Syene. So, he sent a slave to Alexandria to measure the shadow cast by a tall tower there; and using ratios, he was able to calculate the circumference of the earth. |
MethodsEratosthenes' method can be adapted to the Spring or Fall Equinox when students are in school. And, the equator can be used as the reference point for any school location. Stand a gnomon (meter stick) vertically on a flat surface within one day of the Equinox and plot the shadow tip position over some time spanning midday. |
|
Using the shortest shadow length and trigonometry, determine the angle of declination. |
| Share this information with a distant site (or use the equator) to determine the circumference. | 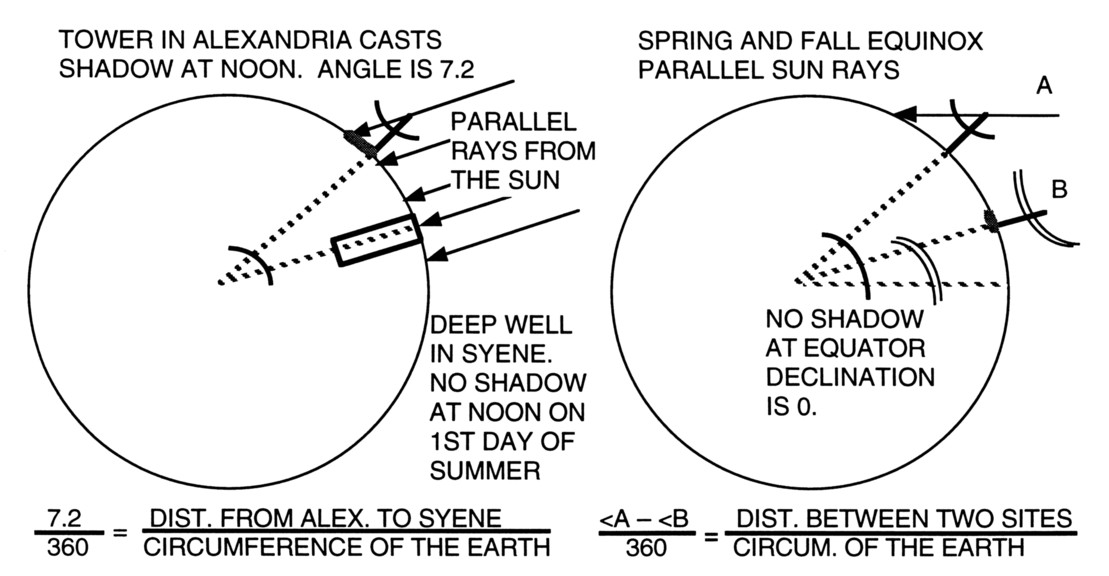 |
Experimental ErrorSolving problems associated with acquiring precise experimental data are a valuable part of the project experience. Setting up a vertical stick on a flat surface, deciding how to mark a fuzzy shadow tip, dealing with a cloudy day, deciding how long the time span should be, reconciling variations in measurement from different teams are just some of the issues to be resolved in choosing the data to use in the calculations.
Related TopicsA number of related projects have been proposed by MVHS teachers. These topics provide opportunities for students to:
1. Use curve fitting and other graphical analysis techniques. Each project has a code indicating the time commitment for data collection for the project.
S = short time span
Declination and Altitude of the Sun1. Measure the shortest shadow length on the Equinox. The fact that the sun's declination at local noon on the Equinox is equal to the latitude of the observer can be used to verify the student's determination of shortest shadow length. Students might draw a diagram explaining why the declination angle is equal to their latitude. (S)2. What effect does latitude have on altitude or declination on an arbitrary day? Find out using data from various latitudes. (I) 3. Plot altitude at local noon throughout the year. What kind of curve results? (E) 4. Plot the altitude from sunrise to sunset for several days. How does the shape of the daily altitude curve change over an extended period? This is especially meaningful as the season progresses from one of the solstices. (E)
Shadow Length5. Plot the length of the shadow vs. time from sunrise to sunset and fit the best curve to the data. What kind of curve is it? How is error related to the amount of data available? (D)6. Determine the rate at which the shadow length changes over a day. Can you relate this to the speed of rotation of the Earth at your latitude? (D) 7. Compare the curve of length vs. time at your location to curves at other latitides and/or longitudes. Is there a detectable difference in the equation of the curve? What does it mean? (I) 8. Compare the rate of change of shadow length for different locations. Can you relate rate differences to variations in latitude? (I)
Shadow Path9. Track the path of the gnomon's shadow over an extended period of time during a day. How would you describe its shape? (D)10. If you mark the position of the tip of a fixed gnomon's shadow at local noon over a year, the track will be an elongated figure eight (or propeller shape), with one lobe larger than the other. The shape is called an analemma. How does the size ratio of these lobes relate to latitude? What is the reason behind this pattern? (IE) 11. Compare analemmas for different locations. Is the proportionate size of the lobes a predictor of the analemma's latitude? (IE) 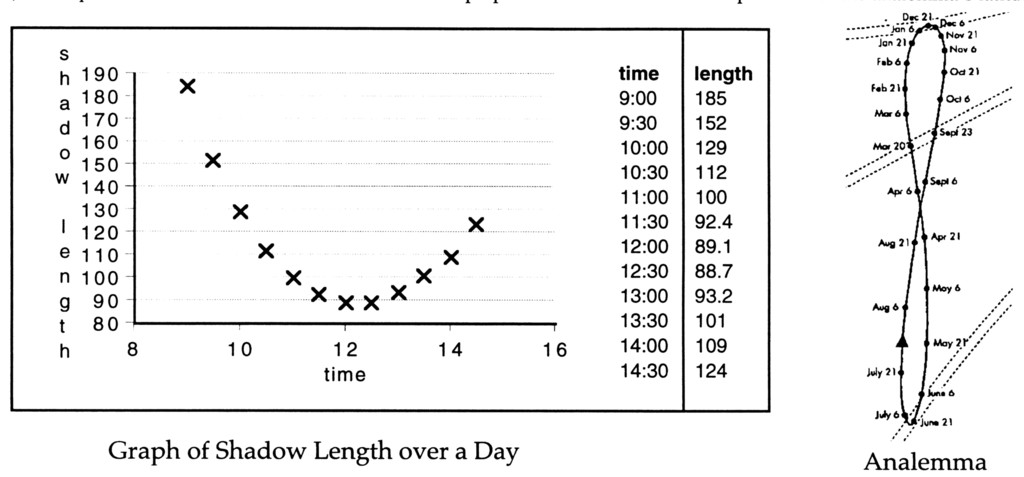
Magnetic Variation12. On any sunny day, locate the magnetic compass direction of the gnomon's shadow at local noon. Since that shadow aligns with a True North-South line, we can subtract to find the local "magnetic variation" (sometimes called "magnetic declination") which is measured in degrees east or west of True North. (S)13. Plot magnetic variation data as a function of latitude and/or longitude in polar coordinates to locate the Magnetic North Pole. (I)
Sunrise/Sunset Times and Length of Day14. Calculate the Earth's tangential rotational velocity using times of sunrise, sunset, or local noon for two places on a given day. Find the horizontal distance between the sites. Divide by the difference in Universal Times. How does rotational velocity relate to latitude? (linear, parabolic, trigonometric)? (I)15. Compare times of sunrise and sunset at various locations and plot as a function of latitude. Is longitude a factor in sunrise or sunset times? (I) 16. Plot length of day at various locations as a function of latitude. For a given winter day, predict the lowest latitude where the Sun stays below the horizon. (I)
Matlab Programs
Internet Resources |
|
|