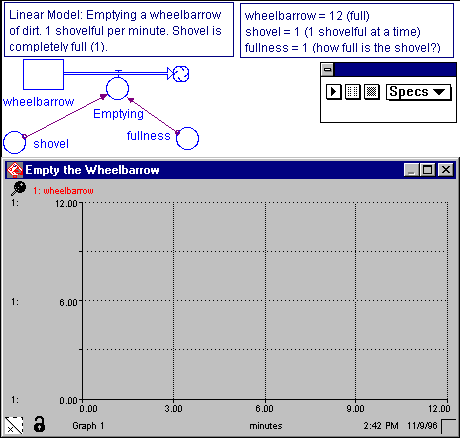
To illustrate a linear decay model, let's use the simulation of emptying a wheelbarrow of dirt. The wheelbarrow (stock) is initially full. The amount of dirt emptying the wheel barrow (flow) is determined by the number of shovels and how full each shovel is, per timestep. In this case, every minute,1 shovelful filled to capacity is taken from the wheelbarrow. Click here to see model run.

To create this model:
- We need to "drill down" to the modeling layer of STELLA. The opening layer is the diagram layer. Locate the downward pointing arrow in the left column. Click on it and you will move to the next level...mapping. You should see a globe. Click on the globe and you will move to the modeling level. you should see an X squared icon.
- Locate the stock icon, click on it and insert it into your workspace. Give it the name Wheelbarrow. Double-click on it so that you can provide it with a value...in this case 12.
- Locate the flow icon, click on it and place it in the center of the stock, click and drag the flow so that it is pointing out of the stock. Since we are creating a decay model, we want the flow to exit the stock. (For linear growth, point your flow into the stock). Give it the name Emptying.
- Insert a converter and give it the name shovel. Double-click on it and give it the value 1.
- Select a connector and connect the converter to the flow.
- Insert another converter, give it the name fullness, the value 1, and connect it to the flow as well.
- Double click on the flow. You will see a box entitled required inputs. Click on shovel, click on the asterisk and click on fullness. Click OK. The asterisk is the multiplication symbol. The flow will be equal to the the shovel's holding capacity multiplied by its fullness.
- The model is complete. Let's see the behavior of our system by viewing its graph. Double click on the graph icon. Click on Wheelbarrow and then click on the workspace. Double-click on the graph and provide it with the proper settings such as DT=1, selecting the model part to be graphed (stock)and setting the range of values.
- Run the model.