
|
We will now examine how a quality indicator may depend on variables other
than precipitation.
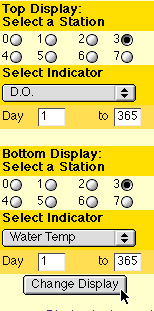
From the previous graph screen, radio buttons for both top and bottom graphs
were changed to Station 3. The indicator dissolved oxygen (D.O.) was selected from
the menu for the top display, and water temperature was selected from the
menu for the bottom display. The full year range of data was chosed for each.
|
| |