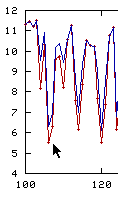
Note that the water temperature doesnt change, but the range of variation in DO decreases. What else is going on to cause this? Is there some other variable that is affecting DO? Check out the stream buffer link to find out! Stream buffers decrease the concentration of another indicator. Why does a lower amount of this indicator mean that less dissolved oxygen is used up?
Also notice there are links below the graphs to retrieve either pre-improved data or post-improved data.

