|
I did this model with my computer programming class. Students were quite excited about using/learning STELLA. Initially, we spent one period talking about systems, having the students give examples of systems and writing system descriptions on the board. These tended to be things like, "you got deer, deer have babies, they eat food, they get eaten, and they get shot by us in hunting season". Then I replaced the word description with a STELLA model - so the "you got deer" became a stock, "deer have babies" became a flow, etc. I wasn't quite sure how well they understood, so I decided to backtrack and deal with systems basics.
I found resources from the Creative Learning Exchange and Diana Fisher's modeling book that helped the students understand the basics of stocks, flows, and graphs. Once they comprehended that a particular model structure produced a predictable graphical behavior, they were able to build their own models. We created a couple of basic models about topics like money and compound interest before addressing the topic of bears.
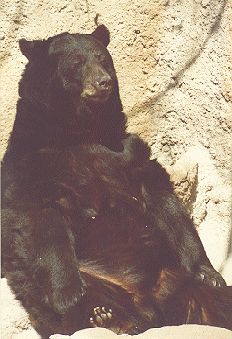
Before building a model, we discussed the factors we needed to know, brainstormed resources we might need, and searched the Internet for relevant information. Then we invited in the local experts to talk to us about bears in Garrett County. This part was the most frustrating and enlightening. We'd get some information from the web only to have a local ranger contradict it only to have that refuted by a university wildlife professor who was then contradicted by the state bear management expert. The students were quite amused to find that no one really "knew" for sure what was going on. They were very surprised to find that many of the numbers which were being bandied about in the paper, and by both sides in our local dispute over starting a bear hunting season, were based on a model developed from a small study that was over twenty years old. The study went as follows - based upon a small number of bears who were tagged, let go, and retrieved in a small section of Garrett County, a population was determined. Say X number of bear. At that time, there were Y number of bear-human interactions. So now, 20 years later, they say that if there are twice as many bear-human interactions, there are twice as many bears. Students were quick to point out the flaws in this logic - a new interstate had been constructed and more people had moved to remote areas - both of which could increase bear sightings without increasing bear numbers. On the other hand, once people living in the woods report one bear sighting, they may not report others. This was, in my opinion, some of the best stuff they got out of the project. They felt that no one had all the answers and their model was as valid as the experts'.
The students attempted to create the initial model so that it matched all of the facts we were given, such as a 50% mortality for first year bears, and a 70% mortality by the time they were mature. We were confounded by two major factors involving our neighboring states: the relocation of many bears into southwestern Pennsylvania and the changes in hunting practices in West Virginia. We attempted to simulate these conditions by making the immigration rate higher for the years when measured migrations occurred. Since we had no numbers, we guessed numbers that produced results consistent with the real data available to us.
For me, one of the most frustrating parts of the modeling process was the contradictory nature of the facts. Information became available at different times, usually when we were almost finished with the part of the model dependent on that data. We made several iterations of the model before completing the final model so by the time we came to the hunting component, the students' enthusiasm had waned considerably. However, they did persevere and ended up with a sophisticated model which they used to predict the impact of instituting a hunting season for the black bear.
|
 Managing wildlife populations is often a controversial topic. When deer populations exceed the carrying capacity of a suburban area, residents see the deer roaming in their backyards eating their prized ornamental plantings. Road kill becomes more prevalent as the deer cross highways in search of mates and food. And yet, deer-hunting is often problematic out of concern for human safety and animal cruelty.
