|
Flowing Through the Scientific Method |
|
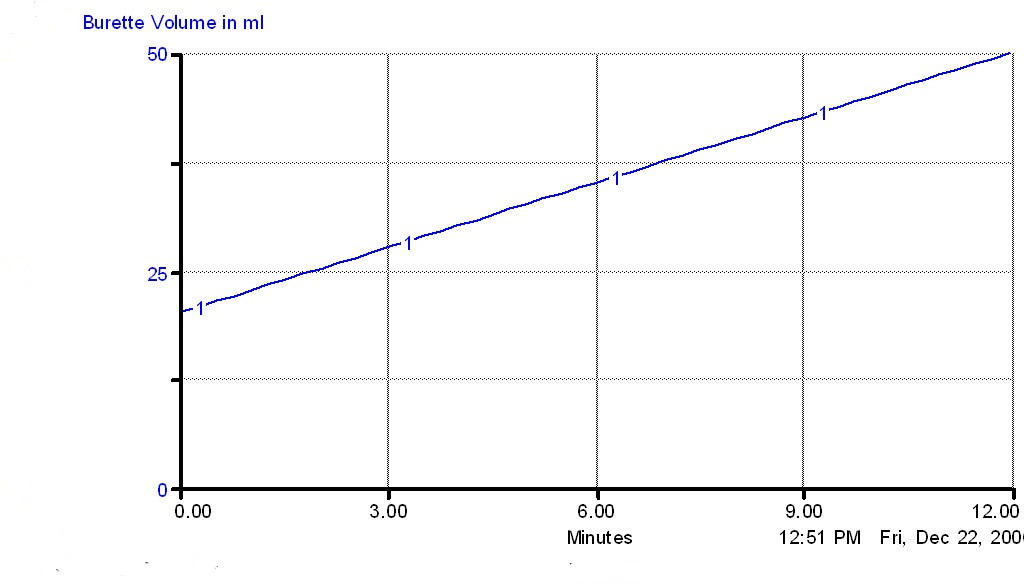
Susan Ragan Maryland Virtual High School of Science and Mathematics Silver Spring, Maryland 20901 Printed in 2000 in MAST Rapper, 25 (4), 14-18. How can students practice generating and testing hypotheses while they hone their data-analysis skills? Teachers are always looking for new activities that will engage their students in the scientific method. MVHS teachers confirm that the flow model, written by Phil Hammond, Ron Peterman, and Paul Mandl, provides an excellent introduction to the scientific method for both biology and chemistry students. The flow model starts by asking an apparently simple question. If a container such as a burette is being filled with liquid at a rate of 4 ml/min while simultaneously losing liquid at the rate of 1.5 ml/min, how long will it take for the burette volume to increase from 20 ml to 50 ml? Since the students assume that both the inflow and outflow rates are constant, they subtract to find the net change (2.5 ml/min) and divide that number into 30 ml to get an answer of 12 minutes. They also draw a graph of burette volume versus time. The graph serves as a reminder that a constant rate of change results in a line with a slope equal to that rate of change. |
|
|
|
|
Being good scientists, the students
must verify their answer to see if their reasoning is correct. The teacher calibrates the inflow to get the number of drops per second that will convert to a 4 ml/min
inflow. The teacher then opens the outflow to yield a 1.5 ml/min outflow. Starting with 20 ml of liquid,
the students wait to see if the burette does fill to the 50 ml mark in 12 minutes. While they are waiting, they
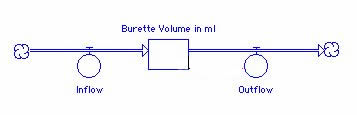
build a STELLA model of the burette problem. Using constant inflow and outflow values, the graph output
by the model matches the graph above.
 Thirty minutes have gone by and the burette volume is hovering around 37 ml. What is going on? The students brainstorm possible explanations. Perhaps the inflow valve became clogged. Or, the inflow might be out of alignment with the burette so some liquid is dripping down the outside of the burette. Or, the teacher might have forgotten to keep the separatory funnel filled with liquid so the inflow stopped completely. After ruling out those explanations, the students look at the outflow. Perhaps the outflow rate speeded up. Why would that happen? Finally, a student thinks of the pressure exerted by the volume of liquid in the burette and realizes that the increased volume would lead to increased pressure, which would force out more liquid with each drop. The teacher points out that this is an example of feedback in a system. The outflow affects the volume of liquid in the burette which, in turn, affects the outflow rate.
The teacher closes the outflow, fills the burette to the 50 ml mark, and closes the inflow. The outflow is then re-opened. As the volume drops, the students record the time it takes to lose 5 ml. To analyze this data, they calculate average outflow rates in ml/min by dividing each 5 ml change in volume by the change in time. Next they plot average outflow rate versus burette volume. (see spreadsheet) Although the relationship appears to be linear, average outflow is actually proportional to the square root of the burette volume. The constant of proportionality may be determined using a power function best-fit.
Using their equation for the outflow rate, the students complete their model, generating this graph. 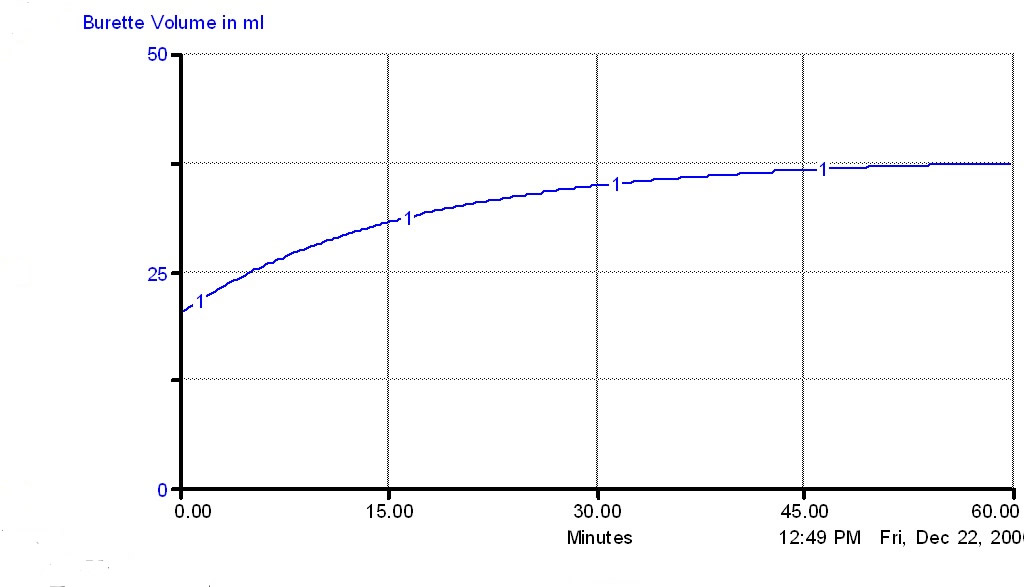 After further discussion, the students realize that this simple apparatus may be used to model any system in which inflow and outflow rates may become equal, thus resulting in equilibrium. |
|
|
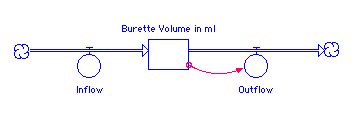 At this point, the students add an arrow to their STELLA model to show feedback.
But how do they determine the mathematical relationship between the outflow rate and burette volume?
After much discussion, they decide they need to collect more data.
At this point, the students add an arrow to their STELLA model to show feedback.
But how do they determine the mathematical relationship between the outflow rate and burette volume?
After much discussion, they decide they need to collect more data.